How To Size A Solar Battery Install
Are you considering installing solar panels on your home? While finding installers and getting quotes may be relatively straightforward, determining the need for and appropriate size for a home solar battery backup system can be a challenge.
Last year, I was going through this process myself, and found it difficult to locate resources that could help me make an informed decision about the size of the battery bank I needed.
In this article, I'll share my experience and provide some guidance to help you properly size your own home solar battery backup system.
Info
The Google Sheet used in this guide can be found here: link
Getting Started
In order to properly size a home solar battery backup system, it's essential to have a clear understanding of your household's energy usage patterns:
- How much energy you consume
- When you consume it
You can usually get this information from your utility company; if not, you can explore purchasing a "home energy monitor" to record the data yourself.
Getting The Data From Your Utility
If you're a SoCal Edison customer, you can download up to 13 months of data (in "CSV" and XML format) from their "Data Sharing & Download" portal:
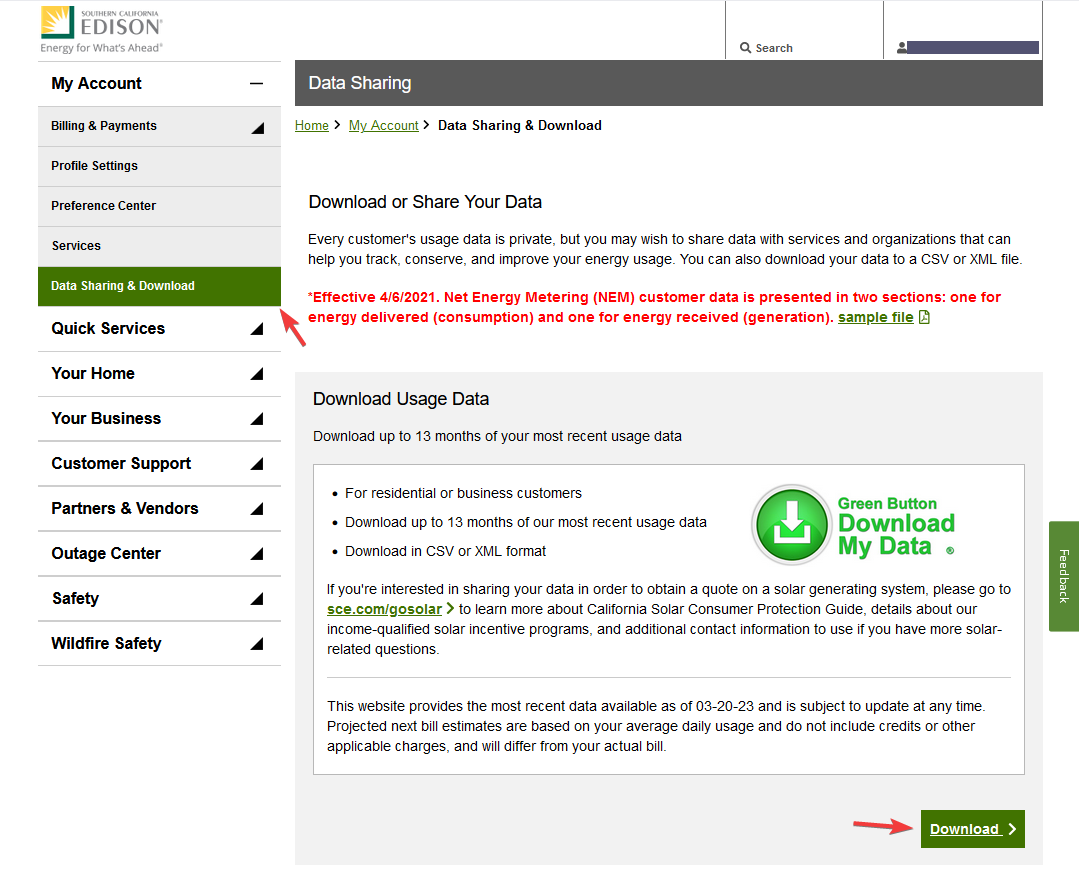
For me, a 13 month .csv export resulted in ~2.5Mb of data.
Measure Your Own Energy Usage
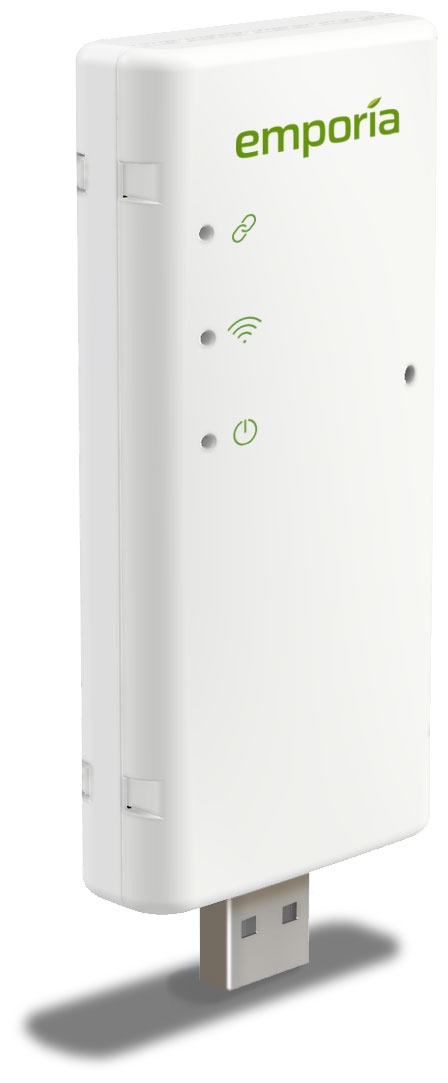
"Home Energy Monitors" are typically HAN (Home Area Network) devices, which communicates with your smart meter using ZigBee.
Check to see if your utility provides incentives for purchasing one. For example, SoCal Edison offers a $25 bill credit if you buy one of their approved HAN devices.
Personally, I use the Emporia Vue Utility Connect (Amazon Affiliate Link).
First, because it's one of the cheaper options, but more importantly, it integrates with Home Assistant's Energy dashboard, has a decent mobile app, and provides access to raw energy usage data in CSV format.
Data Cleanup
Since I was in a hurry, and couldn't wait a year to collect my usage data, I performed my analysis using the exported SoCal Edison .csv data.
Here's a snippet of what it looks like:
Energy Usage Information
"For location: xxxxx"

Meter Reading Information
"Type of readings: Electricity"

Summary of Electric Power Usage Information*
"Your download will contain interval usage data that is currently available for your selected Service Account. Based on how our systems process and categorize usage data, your download may contain usage data of the following types: actual, estimated, validated or missing. "

Detailed Usage
"Start date: 2022-02-20 00:00:00  for 393 days"

"Data for period starting: 2022-02-20 00:00:00  for 24 hours"
Energy  Delivered time period,Usage Delivered(Real energy in kilowatt-hours)(Real energy in kilowatt-hours),Reading quality
"2022-02-20 00:00:00 to 2022-02-20 00:15:00","0.200",""
"2022-02-20 00:15:00 to 2022-02-20 00:30:00","0.190",""
...
"2022-02-20 23:45:00 to 2022-02-21 00:00:00","0.170",""

"Data for period starting: 2022-02-20 00:00:00  for 24 hours"
Energy  Received time period,Usage Received(Real energy in kilowatt-hours)(Real energy in kilowatt-hours),Reading quality
"2023-01-30 00:00:00 to 2023-01-30 00:15:00","0.000",""
...
As you can see, it's got a good bit of cruft, which we'll have to clean-up.
Since my sed and awk-fu is weak, I ended up writing a Python script:
import re
import csv

# Energy data rows look like: "2022-02-20 00:00:00 to 2022-02-20 00:15:00","0.200",""
pattern = r'"(\d{4}-\d{2}-\d{2}) (\d{2}:\d{2}:\d{2}) to (\d{4}-\d{2}-\d{2}) (\d{2}:\d{2}:\d{2})","([\d\.]+)",""'

with open('energy_usage_data.csv',encoding='utf8') as input, open('output.csv', 'w', newline='') as output:
    writer = csv.writer(output)
    writer.writerow(["Start Date", "Start Time", "Start Hour", "End Date", "End Time", "Usage"])

    for row in input:
        # Replace "non-breaking spaces"...
        row = row.replace("\xa0", " ").strip()

        match = re.match(pattern, row)

        if match:
            start_date, start_time, end_date, end_time, usage = match.groups()
            start_hour = start_time.split(':')[0]
            writer.writerow([start_date, start_time, start_hour, end_date, end_time, usage])
The script removes the "non-data" rows interspersed throughout the input file and separates out the date field 2022-02-20 00:15:00 to 2022-02-20 00:30:00 into fields that we can pivot off of in Excel.
Initial Analysis
Let's sanity check and get a feel for the data by creating a couple of quick and dirty pivot charts.
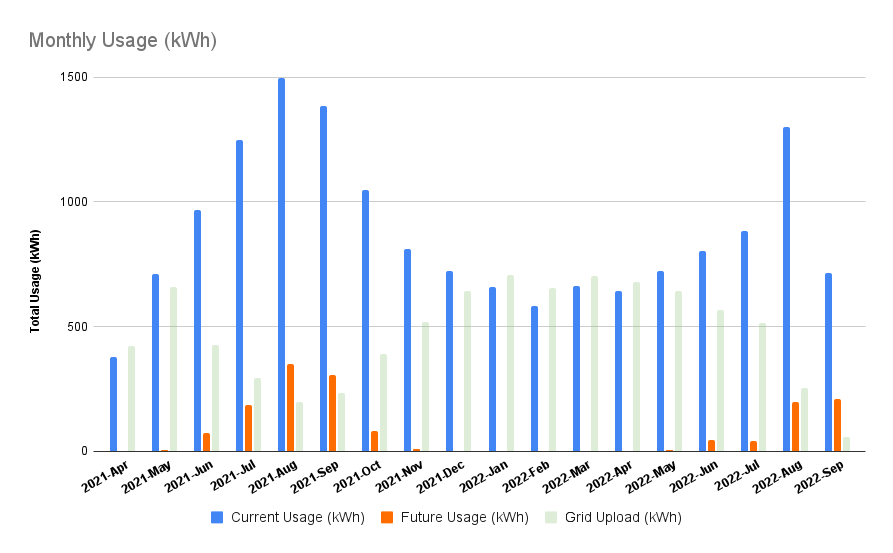
Monthly Usage
Charting the data by month helps us understand the ebbs and flows of our energy usage over the year.
For my dataset, there were no major insights, but it's nice to see our peak demand correlates with summer solstice, a period of peak production for solar installs.
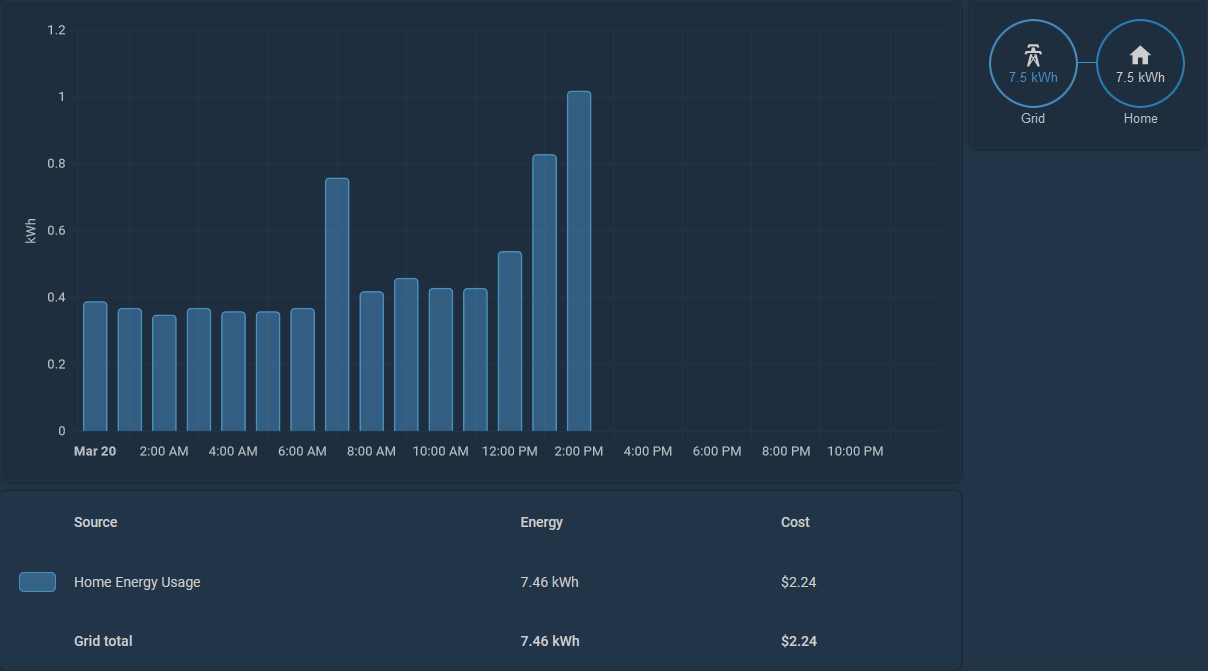
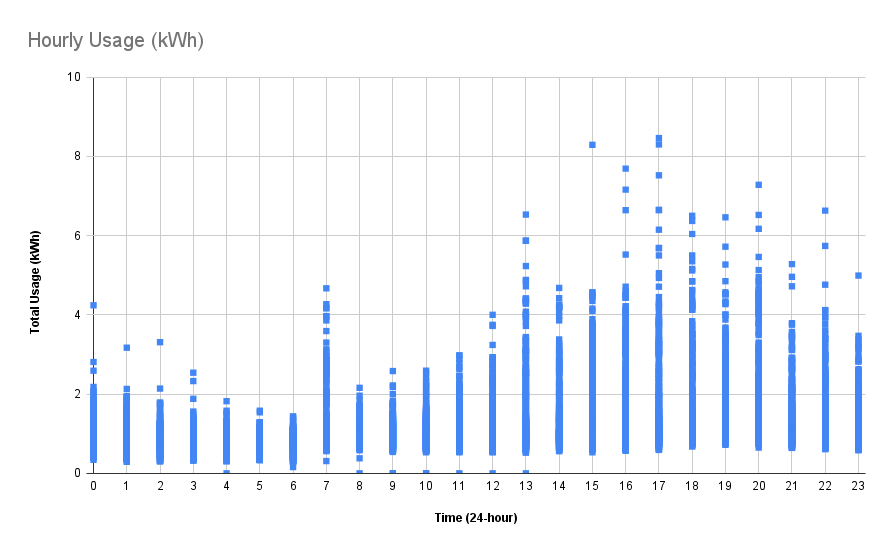
Hourly Usage
This simple scatterplot gives us an idea of how our energy usage is distributed across each day.
For my household, it was interesting to learn that most of our usage occurs after 5pm, typically non-peak production hours for most any solar install.
Taken by itself, this insight provides a pretty strong justification for investing in a battery backup system. Let's dig a bit further to validate this hypothesis.
Advanced Analysis
Now that we have an inkling that a battery backup system might make sense, a few factors that need to be taken into account to determine the appropriate size.
First, you need to calculate your daily energy consumption and the maximum amount of energy that your solar panels can produce. This will help you determine how much excess energy your system generates that can be stored in the batteries.
Second, you need to determine the length of time that you want the backup power to last in case of a power outage. This will help you determine the amount of energy storage capacity that you need.
Daily Excess Power Generated
To create this view, we have to do a bit of estimating, specifically, we have to estimate how much energy our panels generate over whatever time period we're interested in.
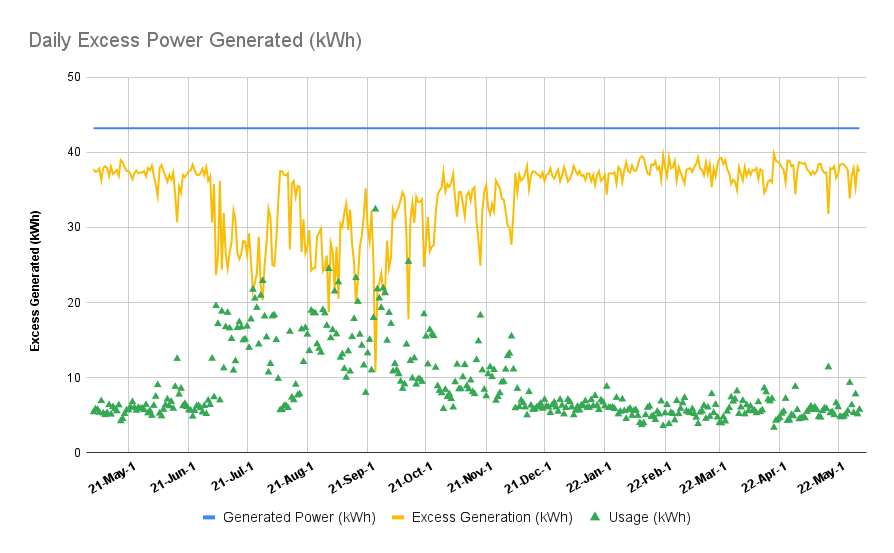
The SoCal Edison data gives us our usage (kWh) in 15 minute increments.
We can roughly estimate our solar install's production over the same period by taking it's "system size" and dividing it by 4.
For example, a 7.1 kWh system would generate about 1.775 kWh over that 15-minute period:
$$ 7.1 kWh / 4 = 1.775 kWh $$ Of course, solar panels don't generate electricity 24/7, so we'll have to ballpark when our system generates power and when it doesn't.
In my model, I estimated that my system would generate 7.1 kWh every hour between 12pm - 5pm, and 0 kWh outside this window.
Plugging this in, I'm able to estimate the "Daily Excess Power (kWh)" of my hypothetical solar install by subtracting the estimated "Daily Generated Power (kWh)" from the "Daily Usage (kWh)", provided by SoCal Edison:
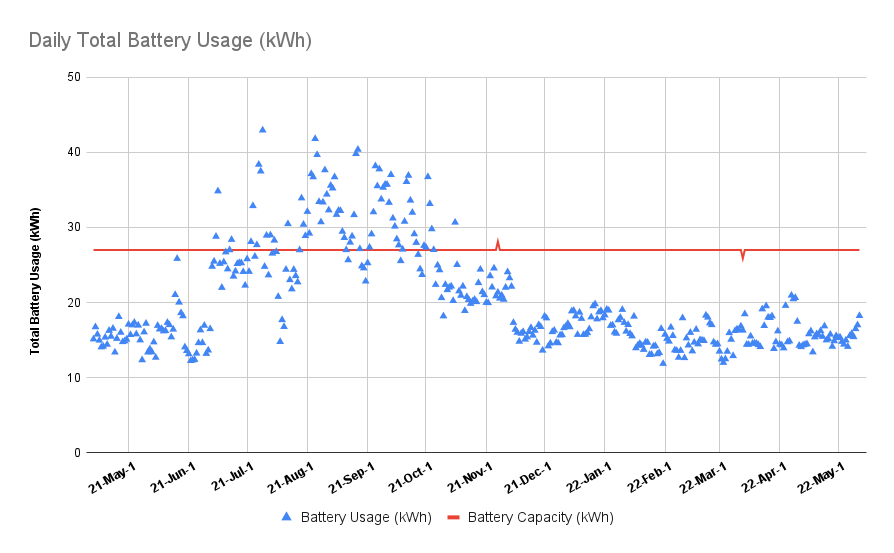
Daily Total battery Usage
Now that we've estimated how much excess capacity our system generates, we know how much capacity our battery system could potentially capture.
Conclusions
After reviewing my data,